
About Me
Toby Liu
Sr. DevOps Engineer @Tesla
GitHub Page: https://liuning0820.github.io/
Grafana As Code
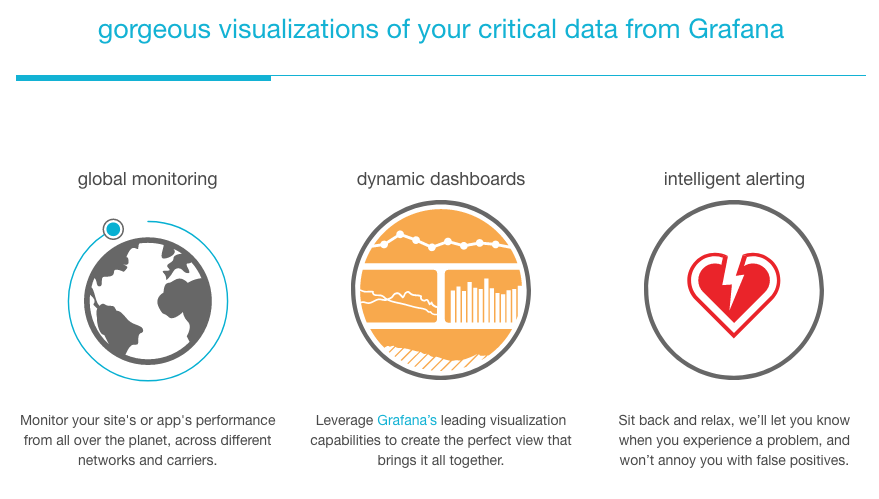
Why Grafana
Platform for Observability through Metrics (ex. Promethues), Logs (ex. Splunk), And Trace (ex.OpenTemlemetry)
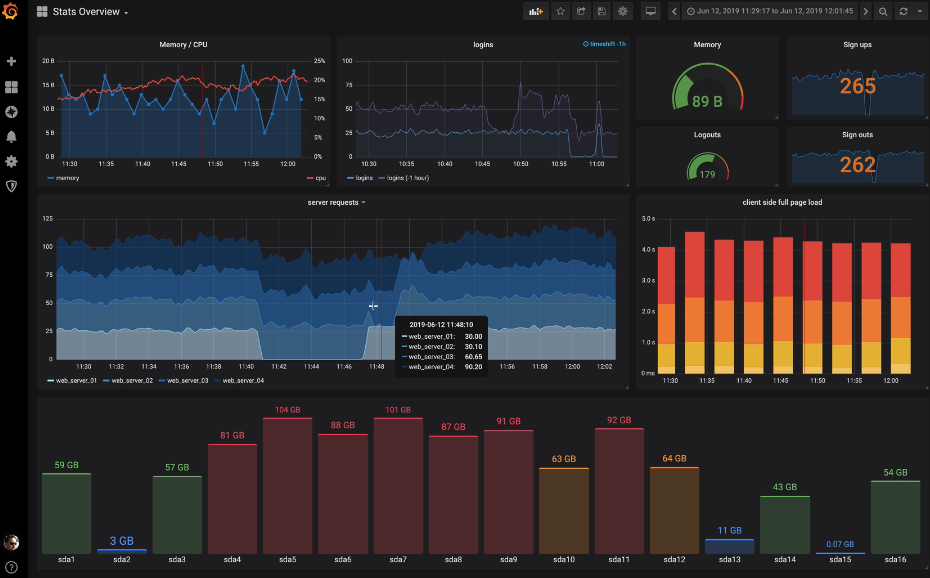
Dashboard
Virtualazation and Monitoring
- Dispaly Data
- Trend History
- Monitoring
How to design dashboard
- Focus on your users, different users have different goals
- See big picture, focus on specific item need attention and action to be taken
Alert Rules and Notification
Data Source
TSDB (time-series database)
The time-series database can be used to analyze the past,monitor now,predict the future.
Relational Database
- mysql, sqlserver
AWS CloudWatch
Mixed Data Source
Plugins
- Trust Plugins and Non-Signed Plugins
- Plugins Type
- Data Source
- App
- Panel
WorldPing
WorldPing network performance monitoring and endpoint health check.
grafana-cli plugins install raintank-worldping-app
FlowCharting
Flowcharting is a panel plugin. Use it to display complex diagrams using the online graphing library draw.io.
grafana-cli plugins install agenty-flowcharting-panel
Provisioning as Code
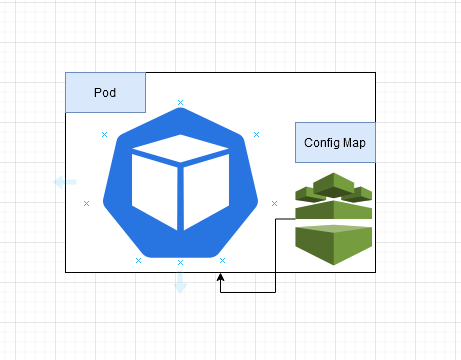
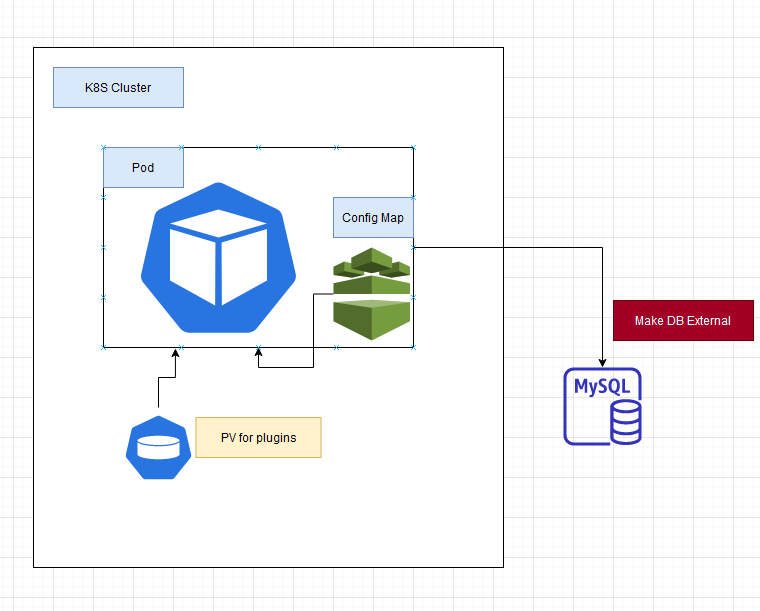
Data Persistent Strategies
Config Map
Phase 1 - Dashboards and Datasource Mount Using Config Map
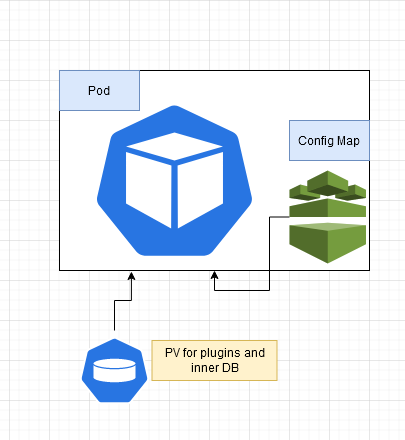
PV
Phase 2 - Using PV for host plugins and internal db
External DB
Phase 3 - Split the db out
CI/CD Pipeline
devops:monitoring instance intro and how to contribute
- manage the config as code, nothing lost, no duplicate work
- easy to boot a new instance
- easy to upgrade
User Management
- Org
- Team
- User
Demo
- demo dashboard playlist
- demo edit flowchart
- demo ci/cd to provisoning a dashboard
- demo worldPing to do EndPoint check